. web development (create web applications on a server)
. software development (work with software developing tools to create work flows)
. mathematics (scientific computing, data analysis, data visualization)
. system scripting
As I am asked the question by a university student and Python is wildly used for data analysis/visualization in university, I going to demonstrate how to qhickly build a Python data analysis/visualization developing environment on Ubuntu 18.10.
Although current major version of Python is 3, Python 2 is still being used by many users. Therefore, both Python 2 and Python 3 packages are shipped with Ubuntu 18.10 release. In order to distinguish from its predecessor Python 2 whose executable is named python, Python 3 executables are usually named with suffix 3 in Ubuntu. For example, python is named python3 for Python 3 and pip3 for Python 3 pip. Here, when I mention Python means Python 3, and will not talk about Python 2.
1. Install Python and pip
To install Python and pip, run commands
sudo apt install python3
sudo apt install python3-pip
sudo apt install python3-pip
Make sure packages are installed,
$ sudo apt list python3
Listing... Done
python3/cosmic-updates,now 3.6.7-1~18.10 amd64 [installed]
python3/cosmic-updates 3.6.7-1~18.10 i386
$
$ sudo apt list python3-pip
Listing... Done
python3-pip/cosmic,cosmic,now 9.0.1-2.3 all [installed]
Listing... Done
python3/cosmic-updates,now 3.6.7-1~18.10 amd64 [installed]
python3/cosmic-updates 3.6.7-1~18.10 i386
$
$ sudo apt list python3-pip
Listing... Done
python3-pip/cosmic,cosmic,now 9.0.1-2.3 all [installed]
Now, it's time to say "Hello World",
$ python3
Python 3.6.7 (default, Oct 22 2018, 11:32:17)
[GCC 8.2.0] on linux
Type "help", "copyright", "credits" or "license" for more information.
>>> print("Hello World")
Hello World
>>> exit()
Python 3.6.7 (default, Oct 22 2018, 11:32:17)
[GCC 8.2.0] on linux
Type "help", "copyright", "credits" or "license" for more information.
>>> print("Hello World")
Hello World
>>> exit()
PIP is a package manager for Python modules, following command lists all modules installed/confugured for Python 3,
$ pip3 list --format=columns
Package Version
--------------------- -----------
apturl 0.5.2
asn1crypto 0.24.0
blinker 1.4
Brlapi 0.6.7
...
Package Version
--------------------- -----------
apturl 0.5.2
asn1crypto 0.24.0
blinker 1.4
Brlapi 0.6.7
...
Nowadays you have Python and installing IPython and Jupyter will be a good idea for the next. IPython and Jupyter are great interfaces to the Python language. If you're learning Python, using the IPython terminal or the Jupyter Notebook is highly recommended.
2. Install IPython
IPython is an interactive command-line terminal for Python and offers an enhanced read-eval-print loop (REPL) environment particularly well adapted to scientific computing. It is a powerful interface to the Python language. With IPython, we generally write one command at a time and get the results instantly. When analyzing data or running computational models, this sort of interactivity is needed to explore them efficiently.
Install IPython by running command,
sudo apt install ipython3
Saying "Hello World" and doing math to prove IPython is installed and working,
$ ipython3
Python 3.6.7 (default, Oct 22 2018, 11:32:17)
Type 'copyright', 'credits' or 'license' for more information
IPython 7.2.0 -- An enhanced Interactive Python. Type '?' for help.
In [1]: print("Hello World!")
Hello World!
In [2]: 2*3
Out[2]: 6
In [3]:
Python 3.6.7 (default, Oct 22 2018, 11:32:17)
Type 'copyright', 'credits' or 'license' for more information
IPython 7.2.0 -- An enhanced Interactive Python. Type '?' for help.
In [1]: print("Hello World!")
Hello World!
In [2]: 2*3
Out[2]: 6
In [3]:
3. Setting up Jupyter with Python
Jupyter is installed with command "pip3 install". It will install the executables into directory $HOME/.local/bin/. $HOME is the home diretory of current user.
Before Jupyter installed,
$ pip3 list --format=columns | grep jupyter
$
$ ls -al $HOME/.local
total 12
drwx------ 3 user01 user01 4096 Dec 26 19:24 .
drwxr-xr-x 16 user01 user01 4096 Dec 28 12:14 ..
drwx------ 16 user01 user01 4096 Dec 26 19:34 share
$
$ ls -al $HOME/.local
total 12
drwx------ 3 user01 user01 4096 Dec 26 19:24 .
drwxr-xr-x 16 user01 user01 4096 Dec 28 12:14 ..
drwx------ 16 user01 user01 4096 Dec 26 19:34 share
Install Jupyter with command,
$ pip3 install jupyter
Check if Jupyter is installed,
$ pip3 list --format=columns | grep jupyter
jupyter 1.0.0
jupyter-client 5.2.4
jupyter-console 6.0.0
jupyter-core 4.4.0
$
$ ls -a $HOME/.local/bin
. ipython3 jupyter-notebook
.. jsonschema jupyter-qtconsole
chardetect jupyter jupyter-run
easy_install jupyter-bundlerextension jupyter-serverextension
easy_install-3.6 jupyter-console jupyter-troubleshoot
f2py jupyter-kernel jupyter-trust
iptest jupyter-kernelspec pygmentize
iptest3 jupyter-migrate
.ipynb_checkpoints jupyter-nbconvert
ipython jupyter-nbextension
You may have to log out the system and log in again to update environment varialbe PATH to include the path to jupyter binary ($HOME/.local/bin), or manually run .profile,
$ which jupyter
$ echo $PATH
/usr/local/sbin:/usr/local/bin:/usr/sbin:/usr/bin:/sbin:/bin:/usr/games:/usr/local/games:/snap/bin
$
$ . $HOME/.profile
$ echo $PATH
/home/user01/.local/bin:/usr/local/sbin:/usr/local/bin:/usr/sbin:/usr/bin:/sbin:/bin:/usr/games:/usr/local/games:/snap/bin
$ which jupyter
/home/user01/.local/bin/jupyter
$ echo $PATH
/usr/local/sbin:/usr/local/bin:/usr/sbin:/usr/bin:/sbin:/bin:/usr/games:/usr/local/games:/snap/bin
$
$ . $HOME/.profile
$ echo $PATH
/home/user01/.local/bin:/usr/local/sbin:/usr/local/bin:/usr/sbin:/usr/bin:/sbin:/bin:/usr/games:/usr/local/games:/snap/bin
$ which jupyter
/home/user01/.local/bin/jupyter
Start jupyter by running command "jupyter notebook" as following,
$ jupyter notebook
[I 15:28:30.462 NotebookApp] Serving notebooks from local directory: /home/user01/.local/bin
[I 15:28:30.463 NotebookApp] The Jupyter Notebook is running at:
[I 15:28:30.463 NotebookApp] http://localhost:8888/?token=0627b6f0811427ce9353ba453a1dbcdb0007dcfc0175a301
[I 15:28:30.463 NotebookApp] Use Control-C to stop this server and shut down all kernels (twice to skip confirmation).
[C 15:28:30.469 NotebookApp]
To access the notebook, open this file in a browser:
file:///run/user/1000/jupyter/nbserver-10444-open.html
Or copy and paste one of these URLs:
http://localhost:8888/?token=0627b6f0811427ce9353ba453a1dbcdb0007dcfc0175a301
It will open a new Jupyter browser tab. From there we are able to create a notebook by pressing the "New" dropdown and selecting the notebook type "Python 3". This notebook is going to be used to run example code to demonstrate how to graph with Python.[I 15:28:30.462 NotebookApp] Serving notebooks from local directory: /home/user01/.local/bin
[I 15:28:30.463 NotebookApp] The Jupyter Notebook is running at:
[I 15:28:30.463 NotebookApp] http://localhost:8888/?token=0627b6f0811427ce9353ba453a1dbcdb0007dcfc0175a301
[I 15:28:30.463 NotebookApp] Use Control-C to stop this server and shut down all kernels (twice to skip confirmation).
[C 15:28:30.469 NotebookApp]
To access the notebook, open this file in a browser:
file:///run/user/1000/jupyter/nbserver-10444-open.html
Or copy and paste one of these URLs:
http://localhost:8888/?token=0627b6f0811427ce9353ba453a1dbcdb0007dcfc0175a301
4. Install Python modules for data analysis and data visualization
In order to graph with Python matplotlib module in script mode, the package python3-tk has to be installed as following,
$ sudo apt list python3-tk
Listing... Done
python3-tk/cosmic-updates 3.6.7-1~18.10 amd64
python3-tk/cosmic-updates 3.6.7-1~18.10 i386
$
$ sudo apt install python3-tk
$
$ sudo apt list python3-tk
Listing... Done
python3-tk/cosmic-updates,now 3.6.7-1~18.10 amd64 [installed]
python3-tk/cosmic-updates 3.6.7-1~18.10 i386
Listing... Done
python3-tk/cosmic-updates 3.6.7-1~18.10 amd64
python3-tk/cosmic-updates 3.6.7-1~18.10 i386
$
$ sudo apt install python3-tk
$
$ sudo apt list python3-tk
Listing... Done
python3-tk/cosmic-updates,now 3.6.7-1~18.10 amd64 [installed]
python3-tk/cosmic-updates 3.6.7-1~18.10 i386
Install Python modules with "pip3 install" command,
$ pip3 list --format=columns | egrep 'numpy|pandas|plotly|matplotlib'
$
$ pip3 install pandas
$ pip3 install matplotlib
$ pip3 install plotly
$ pip3 list --format=columns | egrep 'numpy|pandas|plotly|matplotlib'
matplotlib 3.0.2
numpy 1.15.4
pandas 0.23.4
plotly 3.4.2
$
$ pip3 install pandas
$ pip3 install matplotlib
$ pip3 install plotly
$ pip3 list --format=columns | egrep 'numpy|pandas|plotly|matplotlib'
matplotlib 3.0.2
numpy 1.15.4
pandas 0.23.4
plotly 3.4.2
Numpy is installed automatically as prerequiste while pandas is being installed.
Test matplotlib in script mode
Create text file "matplotlib_subplot.py" with following code:
import numpy as np
import matplotlib.pyplot as plt
x1 = np.linspace(0.0, 5.0)
x2 = np.linspace(0.0, 2.0)
y1 = np.cos(2 * np.pi * x1) * np.exp(-x1)
y2 = np.cos(2 * np.pi * x2)
plt.subplot(2, 1, 1)
plt.plot(x1, y1, 'o-')
plt.title('A tale of 2 subplots')
plt.ylabel('Damped oscillation')
plt.subplot(2, 1, 2)
plt.plot(x2, y2, '.-')
plt.xlabel('time (s)')
plt.ylabel('Undamped')
plt.show()
Then run the script as following,
$ python3 matplotlib_subplot.py
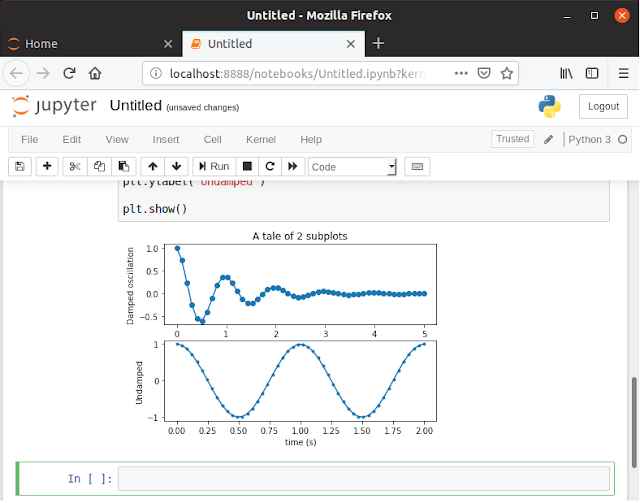
It will show graph,
Test matplotlib with jupyter notebook
Start jupyter notebook, create new Python 3 notebook as following,
Copy code from file matplotlib_subplot.py to "In" box of notebook, then click "Run" button
Result will be,

Test plotly
Technically, plotly graph the data and present the graph with browser. Therfore, browser(firfox, chrome, etc.) has to be installed first. Plotly can works in two mode: online and offline. By default, plotly works in online mode, which requires computer connected to internet and a Plotly account created. To make it simple, here test will be done in offline mode with following code,
import plotly.offline as py
import plotly.graph_objs as go
trace0 = go.Scatter(
x=[1, 2, 3, 4],
y=[10, 15, 13, 17]
)
trace1 = go.Scatter(
x=[1, 2, 3, 4],
y=[16, 5, 11, 9]
)
data = [trace0, trace1]
py.plot(data, filename = 'basic-line.html')
import plotly.graph_objs as go
trace0 = go.Scatter(
x=[1, 2, 3, 4],
y=[10, 15, 13, 17]
)
trace1 = go.Scatter(
x=[1, 2, 3, 4],
y=[16, 5, 11, 9]
)
data = [trace0, trace1]
py.plot(data, filename = 'basic-line.html')
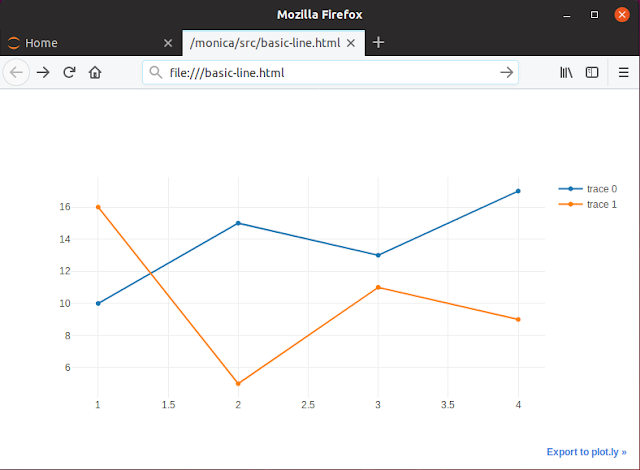
Code can be run in script mode or with jupyter notebook, it will create file 'basic-line.html' in current directory and open the file in browser as following

Now, we can have fun with Python and find lots of interesting examples from internet to test them in our Python.
5. Install MySQL database for Python
When Python deal with big number of data, database is usually needed. One of the most popular databases used with Python is MySQL.
Install MySQL database server with command,
sudo apt install mysql-server
The default password for MySQL super user root is empty, regular OS users will get errors when accessing database,
$ mysql -u root
ERROR 1698 (28000): Access denied for user 'root'@'localhost'
ERROR 1698 (28000): Access denied for user 'root'@'localhost'
Set password for MySQL user root after MySQL installed,
$ sudo mysql -u root
mysql> ALTER USER 'root'@'localhost' IDENTIFIED WITH mysql_native_password BY 'root';
Query OK, 0 rows affected (0.00 sec)
mysql> ALTER USER 'root'@'localhost' IDENTIFIED WITH mysql_native_password BY 'root';
Query OK, 0 rows affected (0.00 sec)
Install Example Database
* Download World sample database scripts (world.zip) from
https://dev.mysql.com/doc/index-other.html
* Extract/unzip file to temporary directory, and run scripts to create database as following,
$ mysql -u root -p
mysql> SOURCE world.sql;
mysql> SOURCE world.sql;
Install Python interface to MySQL
sudo apt install python3-mysqldb
Test connection to MySQL
$ python3
Python 3.6.7rc1 (default, Sep 27 2018, 09:51:25)
[GCC 8.2.0] on linux
Type "help", "copyright", "credits" or "license" for more information.
>>> import MySQLdb
>>> connection = MySQLdb.connect(host="localhost", user="root", passwd="root", db="world")
>>> cursor = connection.cursor()
>>> cursor.execute('select database()')
1
>>> results = cursor.fetchall()
>>> print(results[0][0])
world
>>> connection.close()
>>> exit()
$
Finally, we have Python to graph data from MySQL database. Following code can be run in Jupyter notebook or saved into file to run in script mode,
import MySQLdb
import pandas as pd
import matplotlib.pyplot as plt
connection = MySQLdb.connect(host="localhost", user="root", passwd="root", db="world")
df = pd.read_sql('select Continent, sum(SurfaceArea) as SurfaceArea from country group by Continent;',connection)
connection.close()
x=df['SurfaceArea']
y=df['Continent']
plt.scatter(x,y)
plt.show()
It graphs as following


2 comments:
After a long time, I read a very beautiful and very ismportant article that I enjoyed reading. I have found that this article has many important points, I sincerely thank the admin of this website for sharing it.Best tcpip model service provider
Hey what a brilliant post I have come across and believe me I have been searching out for this similar kind of post for past a week and hardly came across this. Thank you very much and will look for more postings from youftp ports
Post a Comment